Analytics
Gain deep insights into your testing patterns, performance trends, and optimization opportunities with Testr's comprehensive analytics dashboard.
Analytics Overview
Testr's analytics platform provides multiple views of your testing data:
- 📊 Key Metrics Dashboard: High-level performance indicators
- 📈 Trend Analysis: Historical patterns and changes over time
- 🔥 Activity Heatmap: GitHub-style visualization of testing activity
- 🎯 Success Rate Tracking: Monitor test reliability and failure patterns
- 💰 Credit Usage Analysis: Optimize testing budgets and efficiency
- 🤖 AI-Powered Insights: Automated recommendations for improvement
Accessing Analytics
From Dashboard
- Navigate to your Dashboard
- Click "Analytics" in the main navigation
- Select your desired time period (7 days, 30 days, 90 days, 1 year)
Real-time Updates
Analytics data updates automatically:
- Test completions: Immediate integration
- Metrics recalculation: Every hour
- Trend analysis: Daily updates
- AI insights: Weekly generation
Key Metrics Dashboard
Primary Performance Indicators
📊 Total Tests
- Total number of tests executed in selected period
- Trend comparison vs. previous period
- Growth indicator (positive/negative change)
🎯 Success Rate
- Percentage of tests completed successfully
- Period-over-period comparison
- Industry benchmark context
⚡ Credits Used
- Total credits consumed
- Average credits per test
- Budget efficiency tracking
⏱️ Average Duration
- Mean test execution time
- Performance trend analysis
- Optimization opportunities
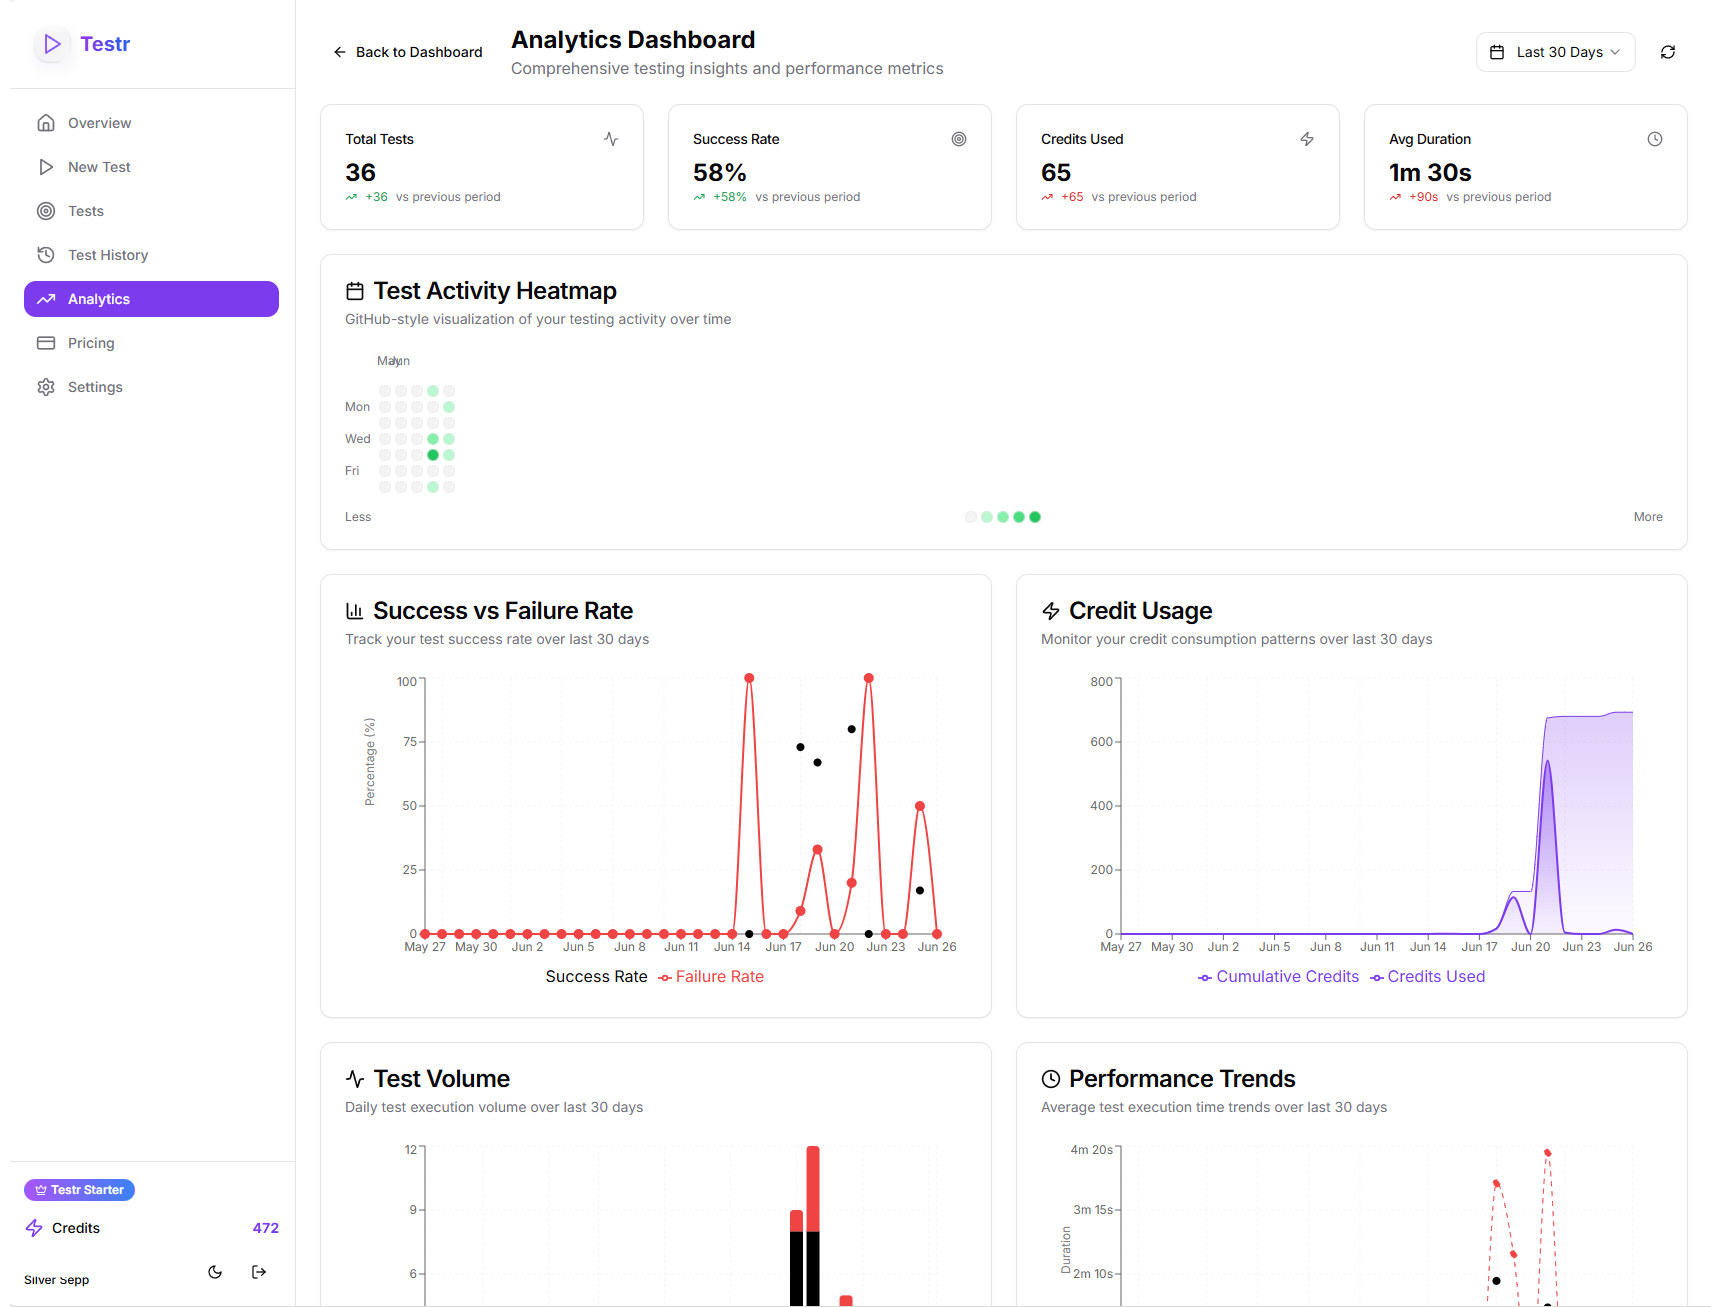 Comprehensive analytics dashboard with key metrics, trends, and AI-powered insights
Trend Indicators
Each metric includes trend arrows showing:
- 📈 Green Up Arrow: Improvement vs. previous period
- 📉 Red Down Arrow: Decline vs. previous period
- ➡️ Gray Arrow: No significant change
Activity Heatmap
GitHub-Style Visualization
The activity heatmap shows your testing frequency over time:
📅 Daily Activity Squares
- Darker Green: More tests executed
- Light Green: Some testing activity
- Gray: No tests on that day
- Hover Details: Exact test count per day
📈 Usage Patterns
- Identify peak testing days
- Spot testing gaps or inconsistencies
- Plan better testing schedules
- Track team adoption over time
Interpreting Heatmap Data
🟢 Consistent Dark Green: Regular, heavy testing (ideal) 🟡 Mixed Light/Dark: Variable testing patterns ⚪ Many Gray Days: Infrequent testing (needs attention) 📊 Weekly Patterns: Identify workday vs. weekend usage
Success vs. Failure Rate Analysis
Interactive Charts
📊 Success Rate Trends
- Line chart showing success percentage over time
- Failure rate overlay for complete picture
- Trend line indicating overall direction
🎯 Failure Pattern Recognition
- Common failure causes
- Time-based failure clustering
- Environment-specific issues
Key Insights
High Success Rate (>90%)
- Well-designed tests
- Stable target environments
- Good testing practices
Medium Success Rate (70-90%)
- Some optimization needed
- Review failing test patterns
- Consider environment stability
Low Success Rate (below 70%)
- Significant issues present
- Test design problems
- Environment or infrastructure issues
Credit Usage Analysis
Spending Patterns
📈 Credit Consumption Chart
- Daily credit usage over time
- Spending trend analysis
- Budget burn rate calculation
💰 Cost Efficiency Metrics
- Credits per successful test
- Most expensive test types
- Optimization opportunities
Budget Optimization
🔍 Usage Insights
- High-Spend Tests: Identify credit-heavy scenarios
- Efficient Tests: Find your most cost-effective patterns
- Waste Detection: Spot unnecessary credit consumption
- Budget Planning: Forecast future credit needs
Test Volume Trends
Execution Patterns
📊 Daily Test Volume
- Number of tests executed per day
- Peak activity periods
- Growth trends over time
📈 Test Type Distribution
- Step-by-step vs. Explorer test ratios
- Average credits per test type
- Success rates by test mode
Capacity Planning
Use volume data for:
- Team Scaling: Plan for increased testing needs
- Credit Budgets: Allocate appropriate resources
- Infrastructure: Ensure platform can handle growth
- Process Optimization: Identify workflow improvements
Performance Metrics
Execution Speed Analysis
⚡ Average Test Duration
- Mean execution time trends
- Performance degradation detection
- Speed optimization opportunities
🏃 Step Execution Speed
- Time per step analysis
- Bottleneck identification
- Efficiency improvements
Performance Optimization
🔍 Slow Test Identification
- Tests taking longer than average
- Performance regression detection
- Optimization recommendations
⚡ Speed Improvement Tips
- Reduce unnecessary verification steps
- Optimize target URL selection
- Choose faster target environments
- Streamline test step sequences
AI-Powered Insights
Automated Recommendations
The analytics dashboard generates intelligent insights:
✅ Success Insights
- "Your tests show consistent 95% success rate"
- "Explorer tests are 20% more efficient than step-by-step"
- "Tuesday testing shows highest success rates"
⚠️ Warning Insights
- "Credit usage increased 30% this month"
- "Failure rate spiked in the last week"
- "Some tests failing due to timeout issues"
💡 Optimization Insights
- "Consider reducing credit budgets for simple tests"
- "Consolidate similar tests into reusable templates"
- "Peak testing efficiency occurs between 10am-2pm"
Insight Categories
🎯 Performance: Speed and efficiency improvements 💰 Cost: Credit usage optimization 🔧 Technical: Infrastructure and reliability issues 📈 Growth: Scaling and adoption opportunities
Time Period Comparison
Flexible Date Ranges
📅 Predefined Periods
- Last 7 days
- Last 30 days
- Last 90 days
- Last year
📊 Period Comparison
- Current vs. previous period metrics
- Percentage change calculations
- Trend direction indicators
Historical Analysis
📈 Long-term Trends
- Identify seasonal patterns
- Track improvement over time
- Measure ROI of testing investments
- Plan future testing strategies
Export and Sharing
Data Export Options
📊 Chart Images: Export visualizations for presentations 📋 CSV Data: Raw data for further analysis 📄 PDF Reports: Comprehensive analytics summaries 🔗 Shareable Links: Team collaboration and reporting
Team Reporting
Share insights with stakeholders:
- Executive Summaries: High-level metrics for leadership
- Technical Reports: Detailed analysis for development teams
- Budget Reports: Cost analysis for financial planning
- Performance Reviews: Success metrics for team evaluation
Integration with Testing Workflow
Continuous Improvement
Use analytics to drive testing excellence:
🔄 Regular Review Cycles
- Weekly team analytics reviews
- Monthly trend analysis
- Quarterly optimization planning
- Annual strategy assessment
📈 Data-Driven Decisions
- Test design improvements
- Credit budget allocation
- Team training focus areas
- Infrastructure investments
Advanced Analytics Features
Custom Metrics
Track specific KPIs relevant to your needs:
- Business-Critical Path Success: Monitor key user journey tests
- Regression Test Effectiveness: Track deployment validation
- Team Performance: Individual and group analytics
- Environment Stability: Success rates by target environment
Alerts and Notifications
Set up automated alerts for:
- Success Rate Drops: Below threshold warnings
- Credit Budget Limits: Spending alerts
- Performance Degradation: Slow test notifications
- Failure Spikes: Immediate issue alerts
Best Practices
Regular Monitoring
📅 Daily Checks
- Review overnight test results
- Check for any failure spikes
- Monitor credit usage against budget
📊 Weekly Analysis
- Analyze trend changes
- Review AI insights and recommendations
- Plan upcoming testing priorities
📈 Monthly Reviews
- Comprehensive performance analysis
- Budget planning and optimization
- Team performance evaluation
- Strategic planning updates
Data-Driven Optimization
🎯 Success Rate Improvement
- Identify and fix failing test patterns
- Optimize test environments
- Improve test design based on analytics
- Monitor success rate trends
💰 Cost Optimization
- Analyze credit efficiency patterns
- Optimize credit budgets per test type
- Eliminate wasteful testing practices
- Plan budget allocation based on usage
Next Steps
Master your testing analytics:
- Create More Tests - Build comprehensive test coverage
- Optimize Execution - Improve test reliability
- MCP Integration - Automate testing workflows
- Set Up Alerts - Get notified of important changes
Ready to integrate with AI assistants? Explore MCP Integration for advanced automation!